
Knowing who your stakeholders are and what they care about is essential for making informed decisions, building good relationships, and getting the results that you want. But how do you know which stakeholders will impact your project? One way to manage your stakeholders more effectively, is through stakeholder mapping.
Stakeholder mapping enables business operations to visualise and analyse their list of stakeholders in a geographical manner. This versatile tool not only helps to identify hot spots for significant activity areas but also provides valuable insights into the relationships and dynamics between different stakeholder groups.
In this article, we will explore the power of stakeholder mapping and how geographical mapping can help organisations to achieve their goals.
What is Stakeholder Mapping?
Stakeholder mapping is a versatile tool that can help organisations to accurately pinpoint stakeholders, hotspots for common issues, sentiment interactions, and properties into your database.
By mapping stakeholders onto a custom project base map, organisations can visually represent the distribution of stakeholders in relation to their projects. This allows organisations to have a better understanding of the geographic distribution and concentration of stakeholder groups.
Additionally, stakeholder mapping enables organisations to compare and contrast data across different layers. This means that organisations can overlay and analyse various data sets or dimensions such as demographics, interests, level of impact/influence, and power dynamics. By doing so, organisations can gain insights into the relationships and interactions between different stakeholder groups and identify potential areas of conflict to manage closely.
What are the Benefits of Stakeholder Mapping?
Stakeholder mapping offers several benefits, including improved decision making, effective communication, conflict prevention, resource optimisation, risk management, enhanced collaboration, and strategic planning. It helps organisations gain insights into stakeholder interests, concerns, and influence, enabling them to make informed decisions and to tailor their communication strategies.
By identifying potential conflicts early on, organisations can proactively address concerns and allocate resources more effectively. Stakeholder mapping also fosters collaboration and partnerships, supports risk mitigation, and aligns organisational strategies with stakeholder expectations. Overall, it is a valuable tool for navigating stakeholder relationships and achieving positive outcomes.
How to Create a Stakeholder Map
Want to learn how you can create a stakeholder map? We’ve got you covered with these 4 easy steps.
- Identify segments searchable data to be mapped
- Optional map customisation
- Add a layer
- Filter your layers
1. Identify segments searchable data to be mapped
To kickstart your stakeholder mapping journey, begin by pinpointing individuals or groups who will be influenced or impacted by your project. Think about breaking them down into categories like stakeholders, segments, or events, so you can then organise them into key groups.
These groups will serve as the building blocks for your stakeholder map, which enables you to organise and visualise your data more effectively.
2. Optional map customisation
Once you have categorised your data into groups, it’s now time to create your stakeholder map. Firstly, determine the specific location you want to map. It could be a city, region, or a more specific site related to your project.
Then depending on the nature of your project, choose a relevant mapping style to your project base map. This might include city plans, zoning details, existing and proposed infrastructure like roads or buildings, project zones, and buffer zones etc.
Lastly, personalise your map by choosing from various display views, including street, bright, light, dark, satellite, or outdoor views. The choice of the mapping style should align with the specific requirements and goals of your project.
For instance, let’s say you’re working on an environmental conservation project that’s focused on protecting a park and its surrounding areas. You might like to include a detailed topographic map of the park and the vicinity. This map might also capture the natural features, such as mountains, rivers, and trails, as well as the park’s boundaries and surrounding regions.
3. Add a layer
Once you’ve got your base map set up, it’s time to add a layer. These layers represent specific data that can be overlaid on top of the base map, giving you deeper context and insights. This can be visualised by utilising markers, heat maps, clusters, or customised visual representations, depending on your preference and the type of data you want to convey.
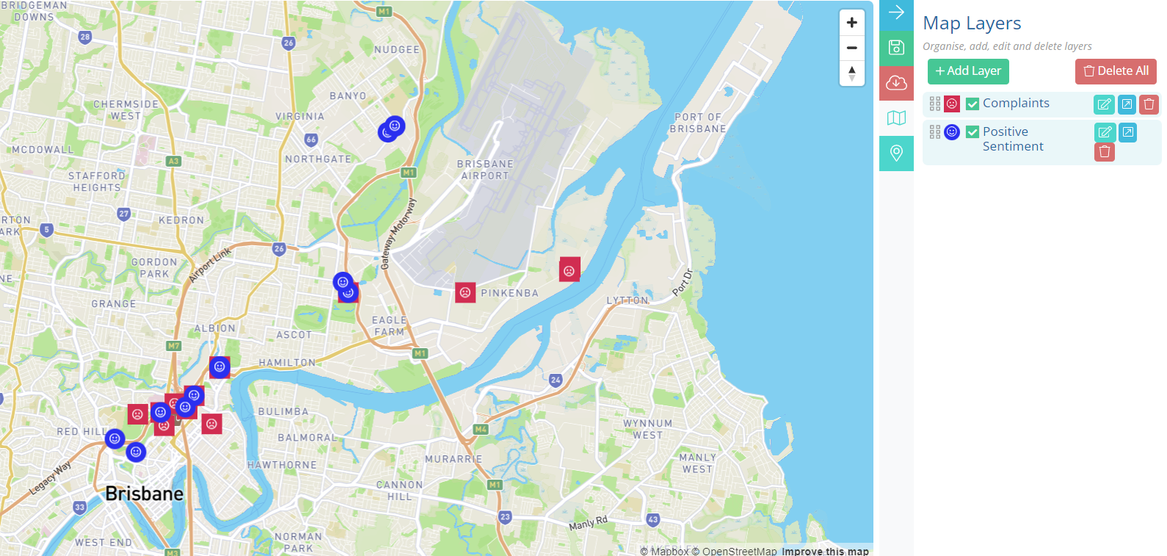
Suppose you want to tackle noise-related issues at an airport, you might like to visually identify and comprehend the areas affected and level of impact by aircraft noise through the use of custom symbols.
For instance, you might use a blue smiley face to depict a positive sentiment, indicating areas with minimal noise disturbance. On the other hand, choose a red angry face to represent complaints, signifying areas where noise levels are high and residents may experience significant disturbance.
By using visual cues and customisation in your stakeholder map, you can identify areas with different levels of noise impact. This will help stakeholders and decision-makers to understand the distribution and intensity of noise, which enables them to prioritise noise mitigation efforts.
4. Filter your layers
After you have added your layers, you then have the option to filter them. Filtering layers for stakeholder mapping allows you to specifically refine and focus your analysis on specific aspects of stakeholder data.
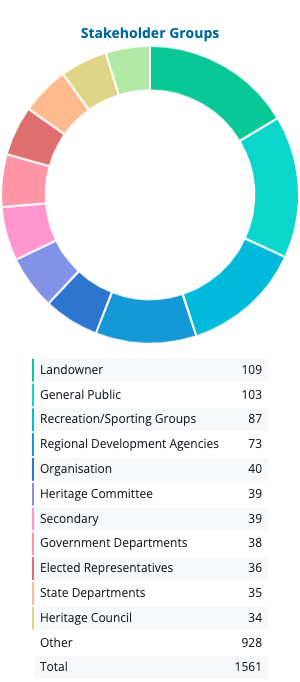
With filtering, you can easily narrow down and view the different types of stakeholders you’re dealing with, their level of interest, and where they are located.
But remember, stakeholder mapping is an ongoing process, and as you gather more insights and engage with your stakeholders, you can continuously refine and update your map to reflect the evolving dynamics of your project.
By visually representing key stakeholders on a custom map, organisations can gain a better understanding and a deeper insight into how their stakeholders are spread out and their level of influence/impact geographically. As a result of stakeholder mapping, it can help organisations to make better informed decisions, mitigate potential risks, build relationships, and navigate stakeholder dynamics successfully, leading to positive project outcomes.